

Bitcoin has recently made headlines, achieving a new all-time high as the crypto market reacts to the optimism brought about by former President Trump’s inauguration. As investors and traders alike celebrate this significant milestone, it’s crucial to keep in mind that while the mood may be buoyant, a degree of caution and prudent risk management is essential.
Technical Analysis
By Edris Derakhshi (TradingRage)
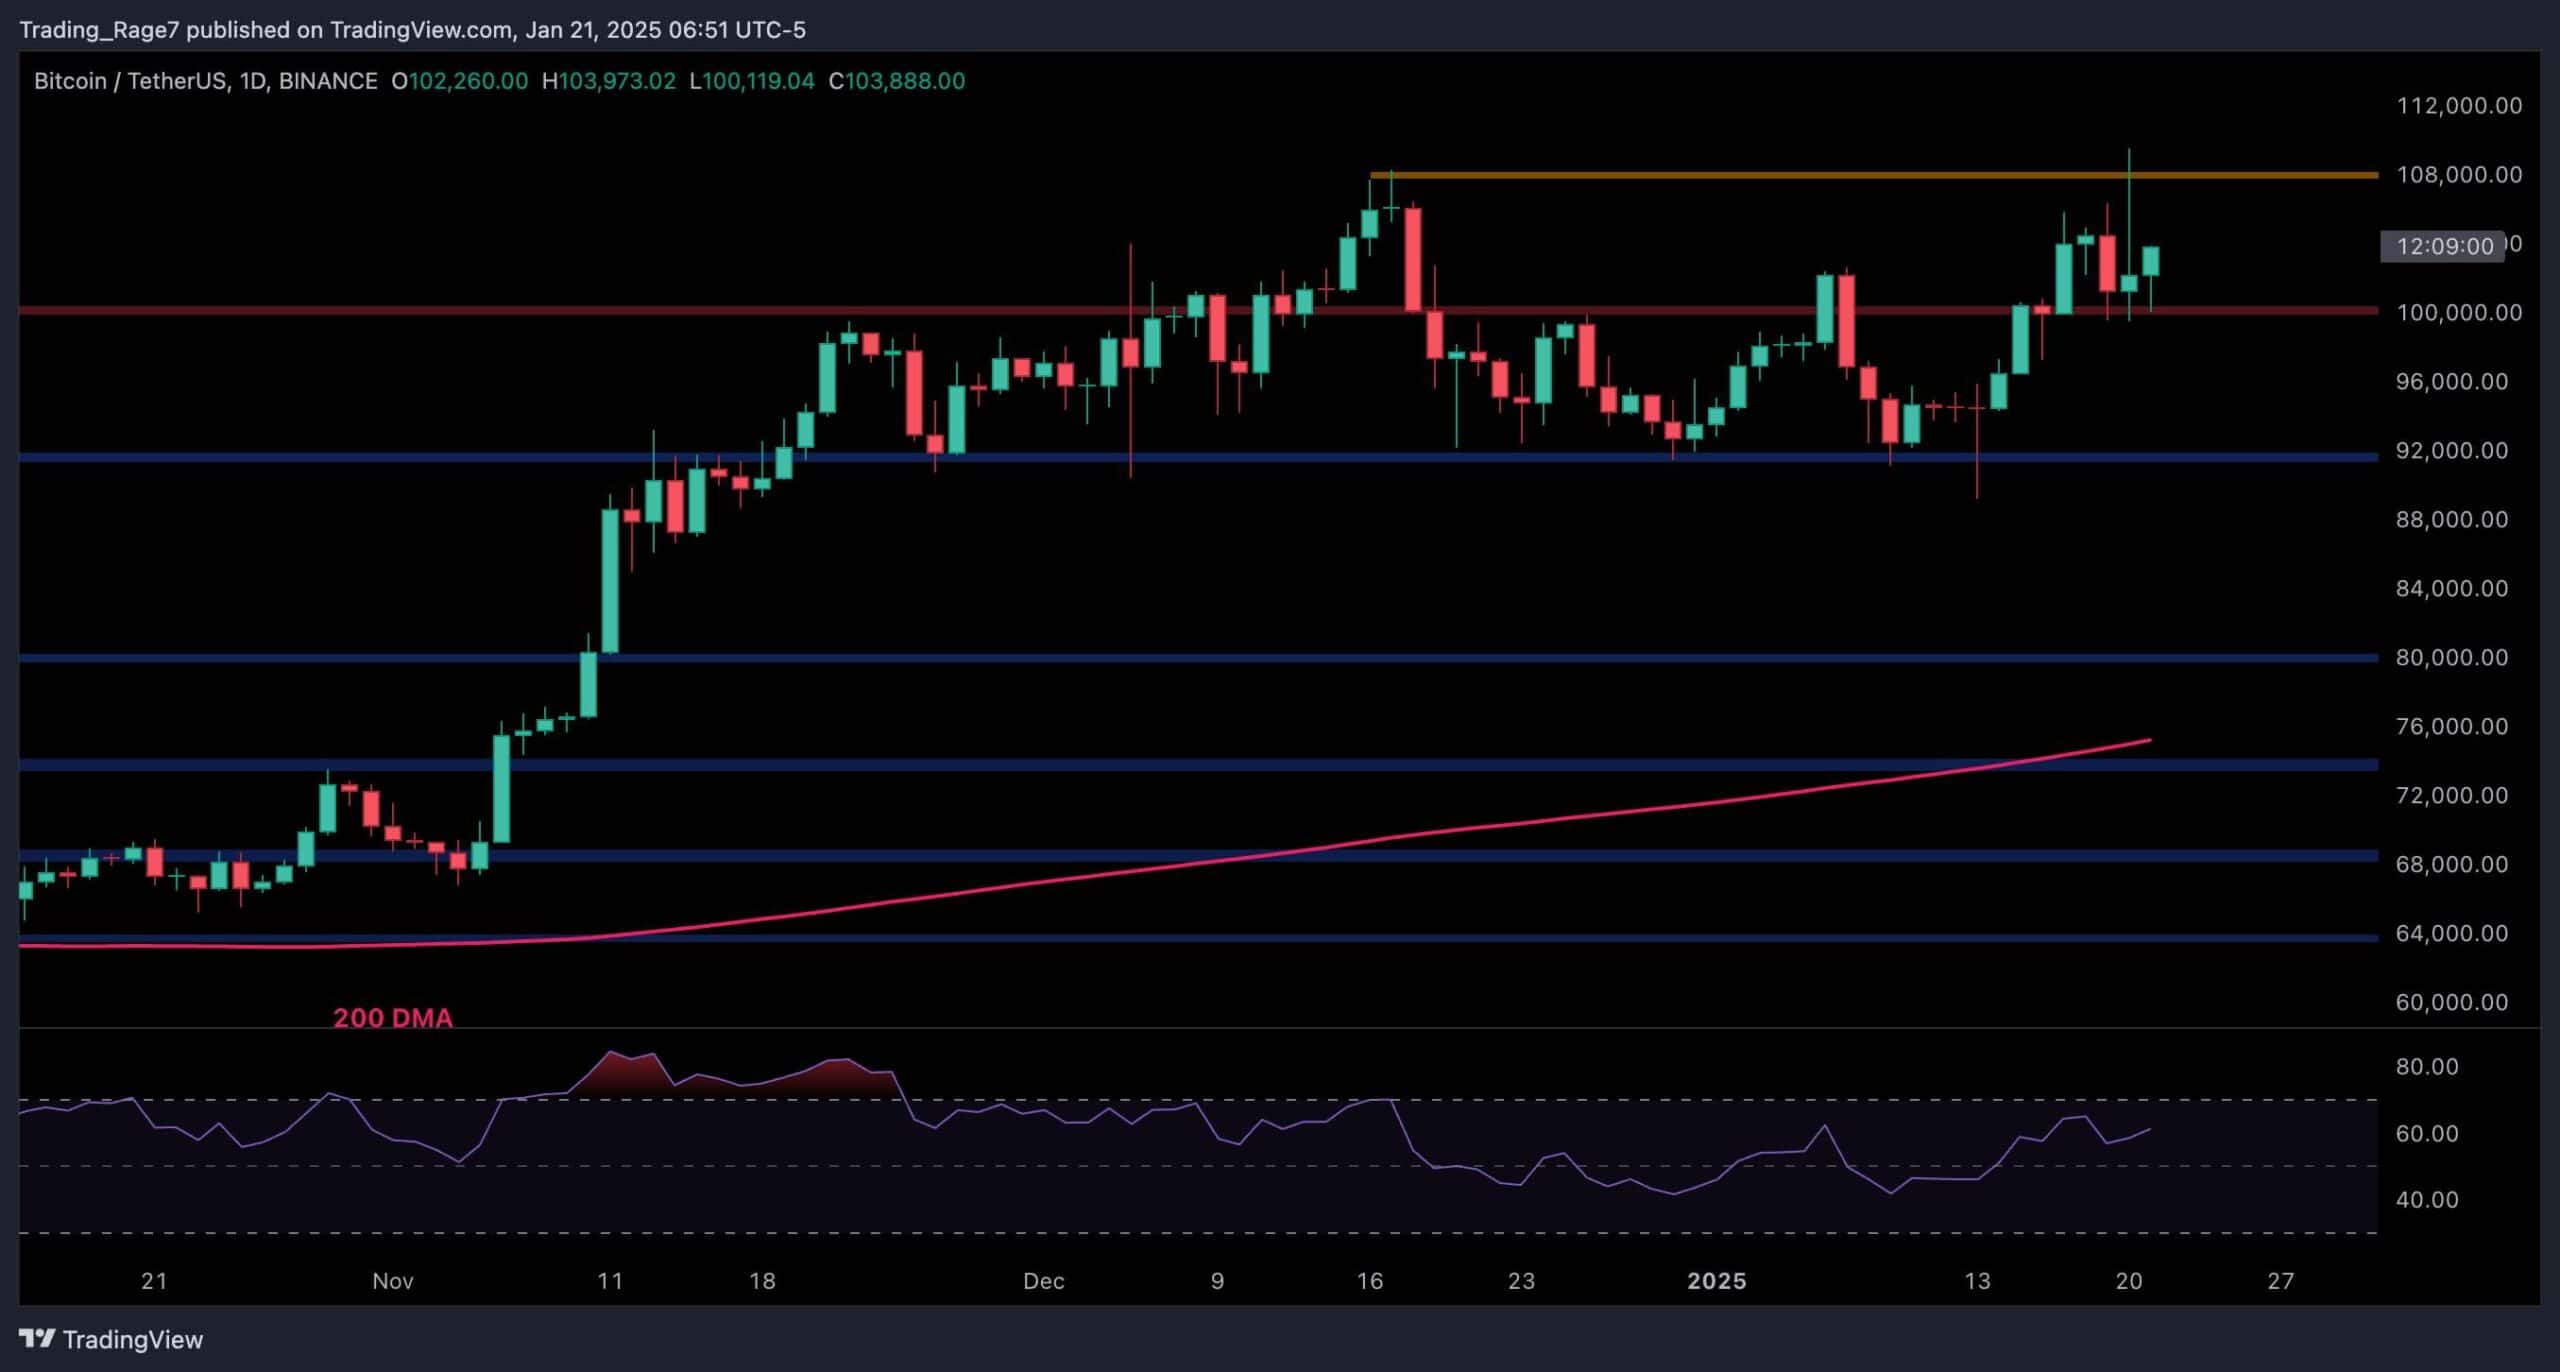
The Daily Chart
The daily chart for Bitcoin reveals a compelling bullish sentiment following a rebound from the $92,000 mark. Crucially, the asset has broken through the psychological barrier of $100,000 and has since revisited this level, which now appears to be a solid support line. This upward trajectory culminated in Bitcoin reaching an unprecedented level around $110,000, marking a pivotal moment for the cryptocurrency.
Indicators such as the Relative Strength Index (RSI) are showing signs of robust bullish momentum. With $100,000 acting as a strong floor, traders may anticipate further rallies, potentially nudging Bitcoin toward the $120,000 threshold in the near future. Here’s a glimpse of the daily chart:
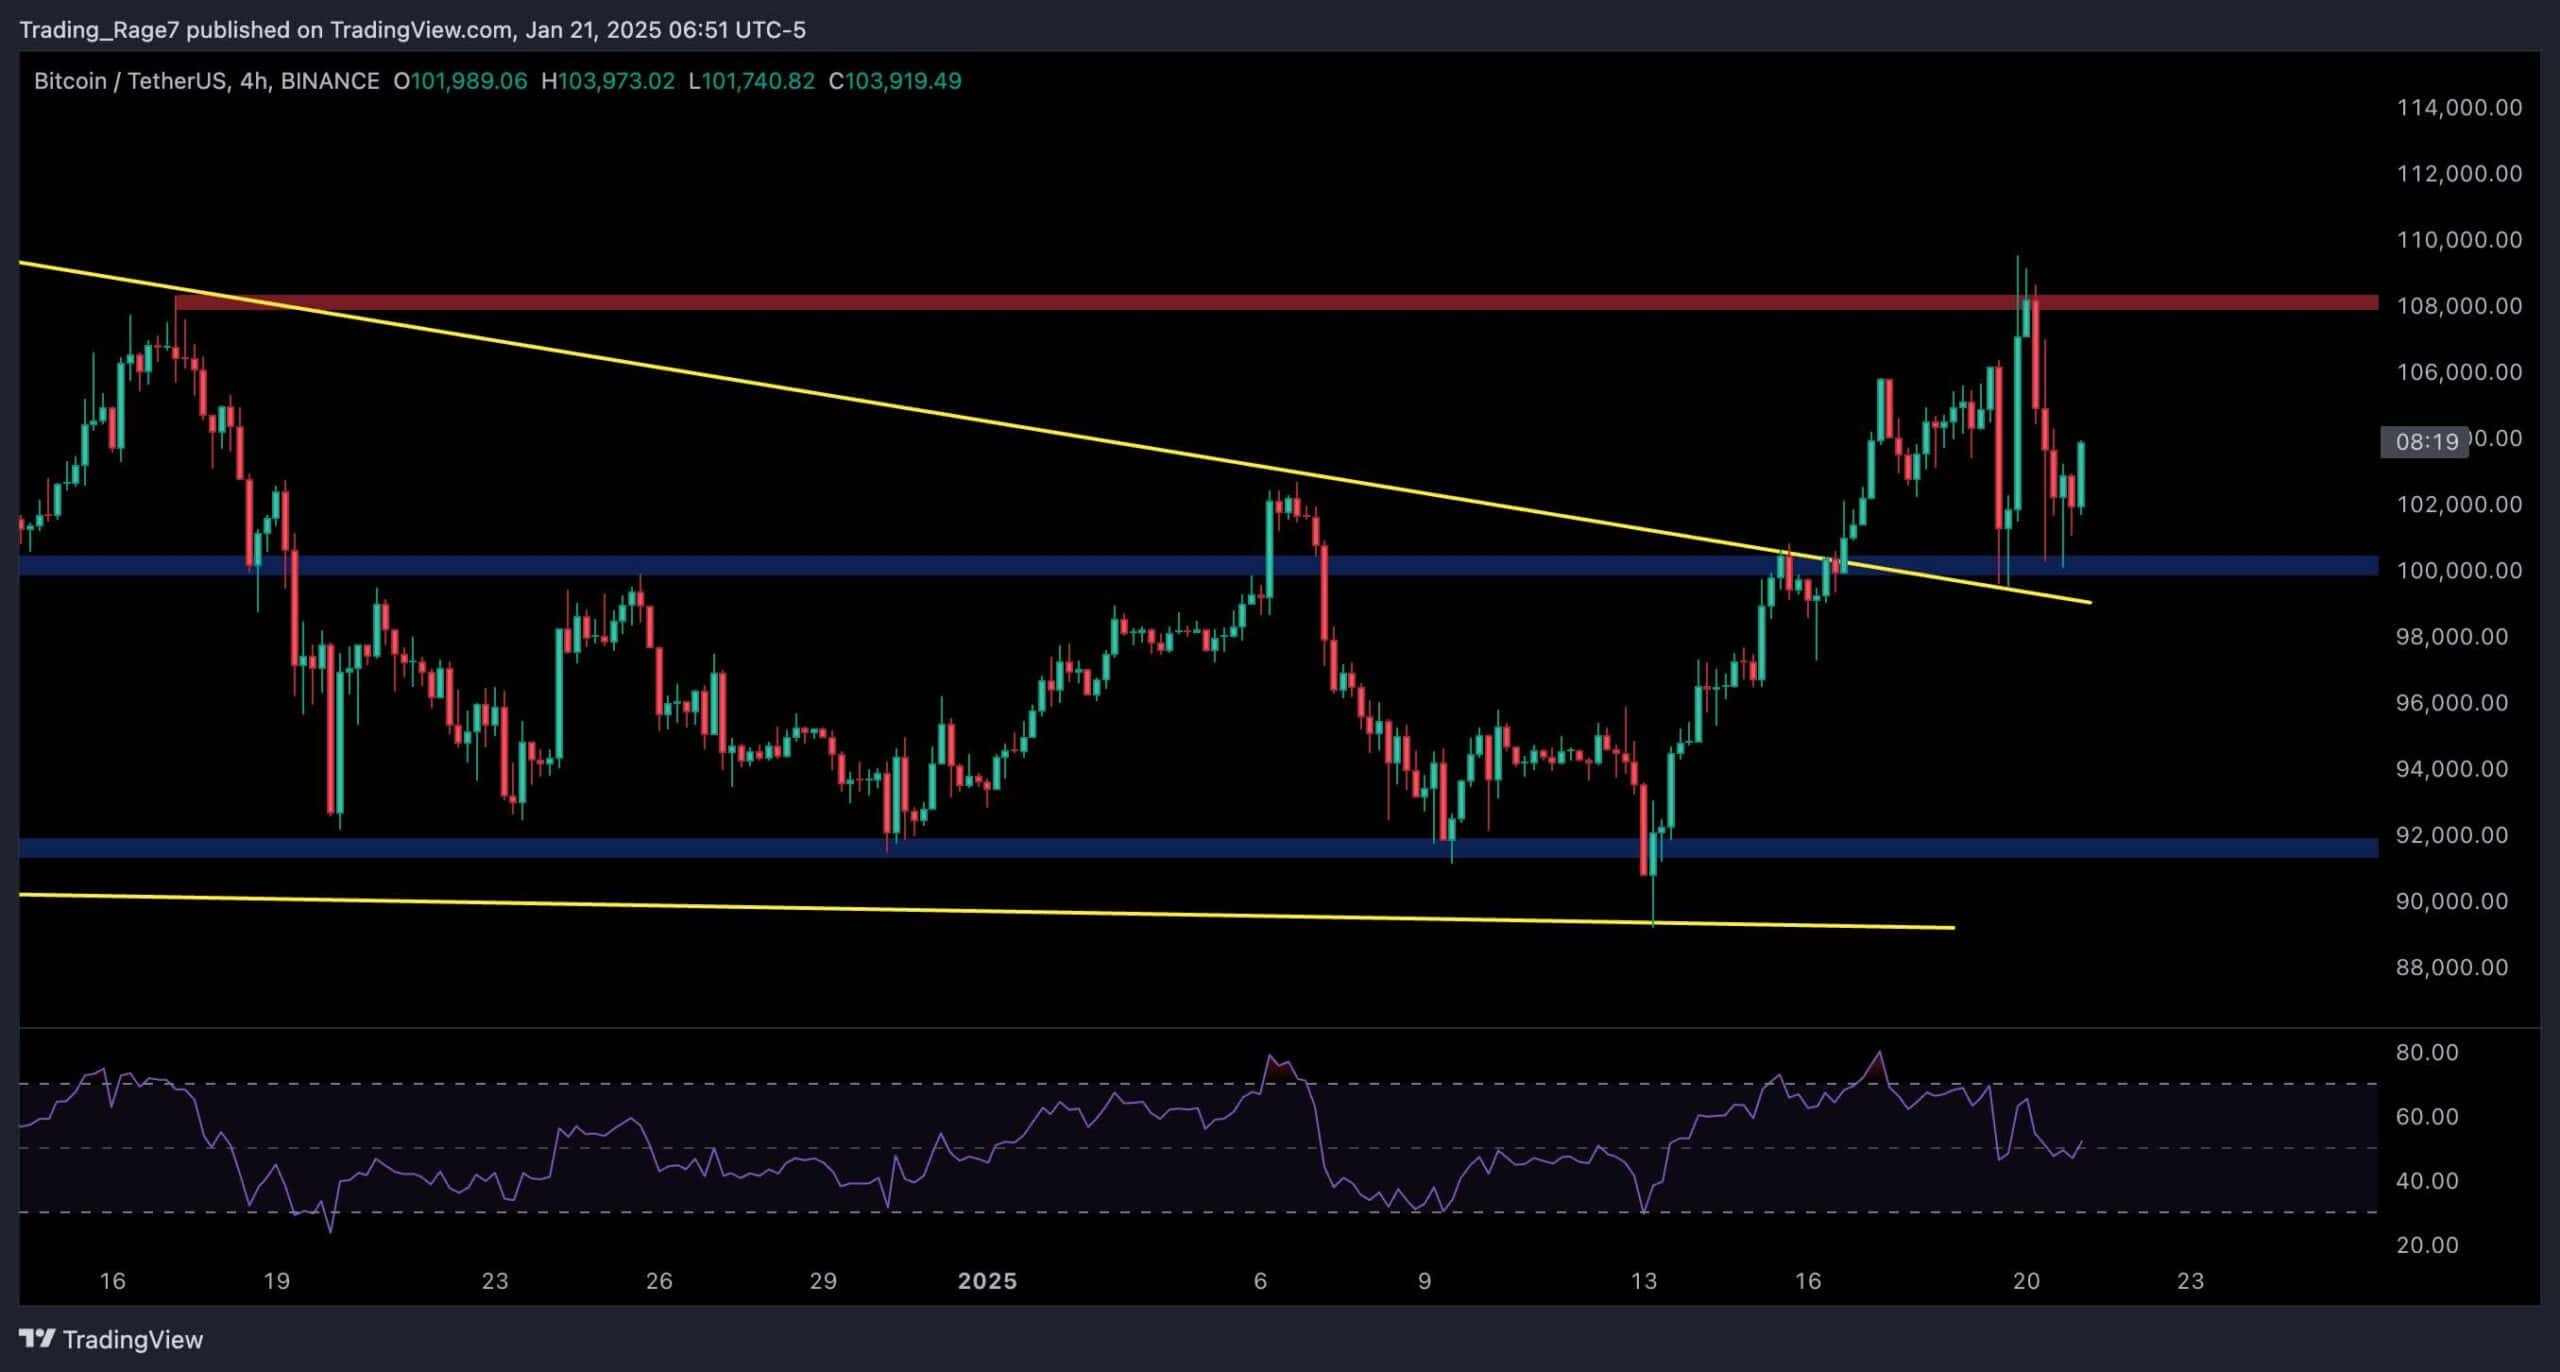
The 4-Hour Chart
Analyzing the 4-hour chart provides insights into the recent price action. A pronounced breakout from a long-standing falling wedge pattern has fueled the surge towards the new all-time high. The upper boundary of this pattern has been successfully retested on multiple occasions, indicating sustained bullish sentiment.
However, a swift rejection at the $108,000 level poses some concerns. Should the price begin to fall and drop below the key support at $100,000, it could trigger a bearish reversal, causing further complications for the current bullish trend. Here’s an illustration of the 4-hour analysis:
On-Chain Analysis
By Edris Derakhshi (TradingRage)
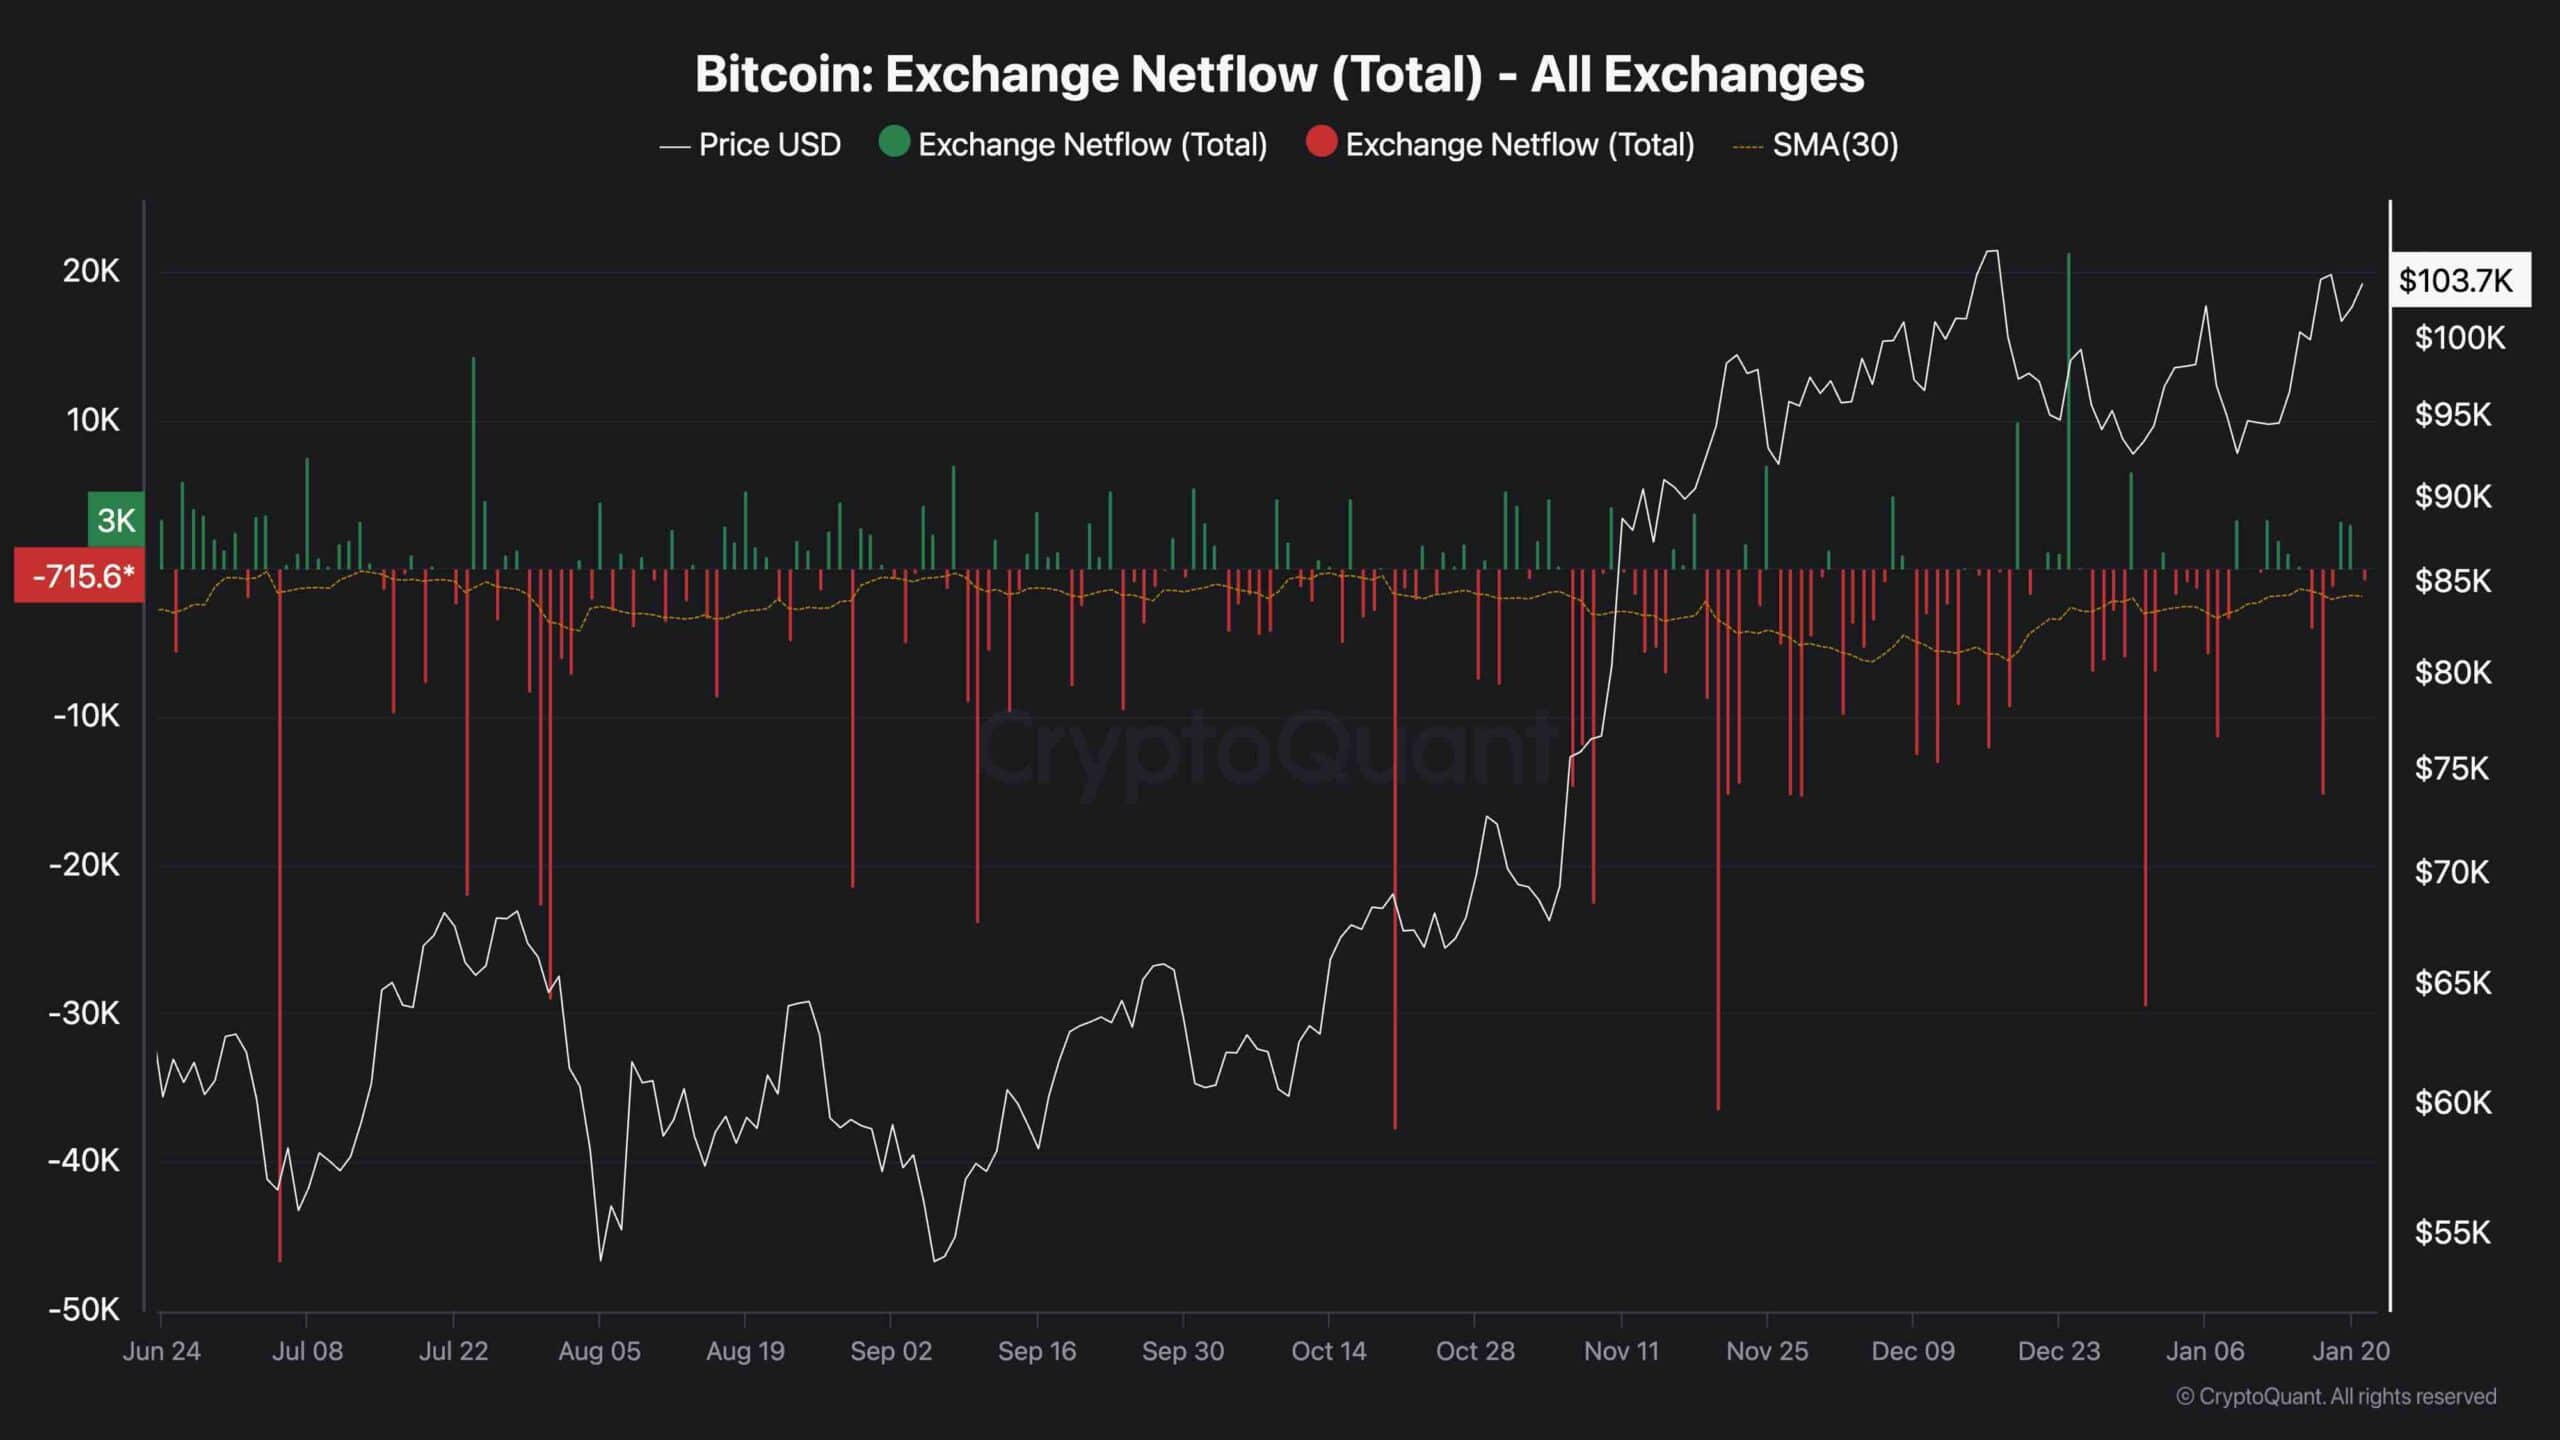
Bitcoin Exchange Netflow
The enthusiasm surrounding Bitcoin’s new record is reflected in the exchange netflow metric, which indicates the balance of Bitcoin deposits and withdrawals on exchanges. A positive netflow signifies that more Bitcoin is flowing into exchanges, while a negative flow suggests that investors are withdrawing their holdings.
Currently, the 30-day moving average of the Bitcoin netflow metric has shown negative values for an extended period. This signals that a considerable number of investors are accumulating Bitcoin, reinforcing the bullish outlook across the market. The expectation is that such accumulation could potentially create a supply shock, driving prices even higher in the forthcoming weeks.
Binance Free $600 (CryptoPotato Exclusive): Use this link to register a new account and receive $600 exclusive welcome offer on Binance (full details).
LIMITED OFFER for CryptoPotato readers at Bybit: Use this link to register and open a $500 FREE position on any coin!
Disclaimer: Information found on CryptoPotato is those of writers quoted. It does not represent the opinions of CryptoPotato on whether to buy, sell, or hold any investments. You are advised to conduct your own research before making any investment decisions. Use provided information at your own risk. See Disclaimer for more information.
Cryptocurrency charts by TradingView.

