

Recently, Solana’s ($SOL) derivatives market experienced a significant upheaval as a wave of liquidations swept through the leveraged long positions. This turmoil followed the price movement through critical levels, underscoring how sensitive the crypto market can be to leveraged bets. Interestingly, while the liquidations unfolded, the $SOL/$BTC trading pair is currently testing a rising trendline after a previous failed breakout attempt, setting the stage for the next structural move in this volatile market.
$SOL Long Liquidations: A Major Clean-Up
Recent data indicates a pronounced clean-up of long positions in Solana after a sharp price drop triggered forced liquidations. According to an analysis shared by crypto analyst CW on X, many leveraged long positions were liquidated as Solana’s price traversed through a critical liquidation zone. The data revealed that significant long liquidation clusters were concentrated primarily between $80 and $83, with a notable zone near $82.8.
Solana Liquidation Heatmap. Source: CoinAnk / X
This liquidation heatmap analyzed positions from major exchanges including Binance, Bybit, and OKX, among others. It became clear that once the price hit the $80 to $81 range, rapid liquidations took place, drastically decreasing the overall long exposure in the market. As of now, the landscape looks drastically different, with most aggressive long positions cleared, leaving behind a smaller pool of long liquidity near current prices.
The market now appears to be in a slightly healthier state regarding long pressure, having absorbed much of the forced selling. However, there’s a noticeable increase in possible short liquidations looming above, particularly in the $90 to $97 range. While this heatmap does not indicate price direction, it clearly illustrates that the pressure from long positions is limited, while potential short positions could exert substantial influence if the price moves upward.
$SOL/$BTC: A Test of the Rising Trendline
In tandem with the liquidation events, the $SOL/$BTC trading pair is undergoing a pivotal moment as it tests a rising trendline. After a previous attempt to break above this trendline failed, the trading pair has returned to this critical support level. An analysis by the trader gnarleyquinn on X paints a picture of Solana’s price action occurring within a tightening structure that exhibits a rising support line meeting horizontal resistance.
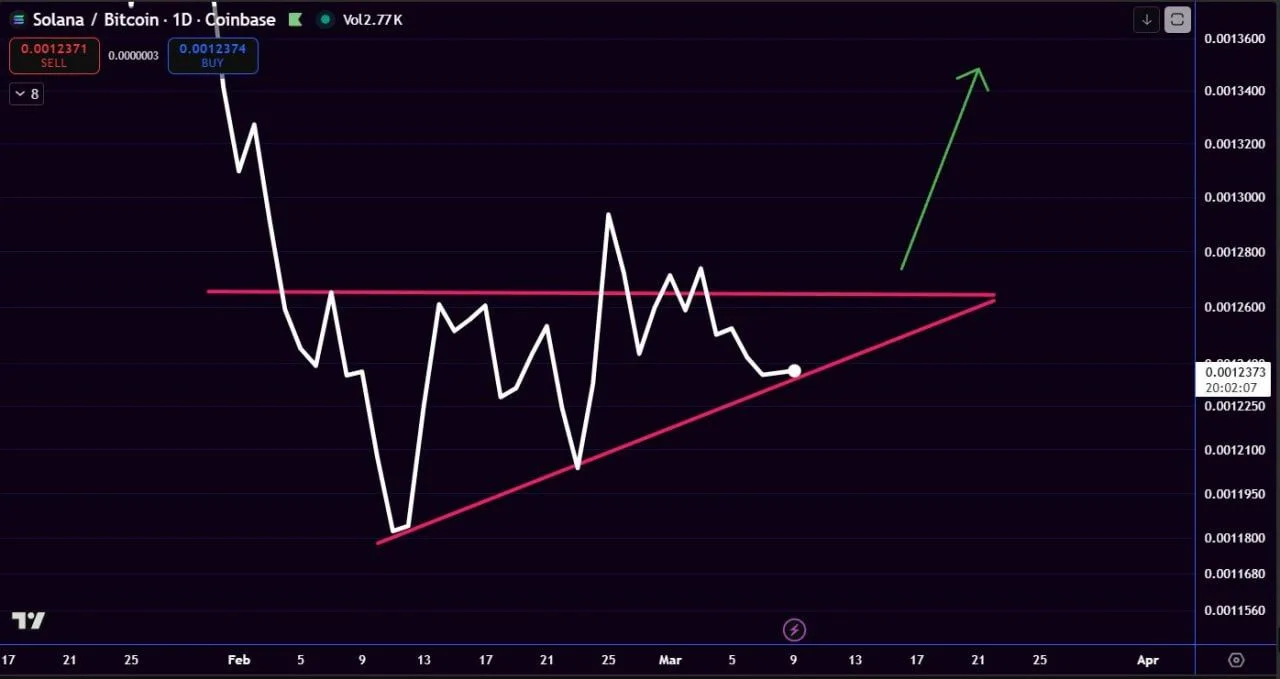
$SOL/$BTC Ascending Trend Structure. Source: X
This earlier breakout attempt was thwarted, pushing the price back into its previous pattern. Following this rejection, $SOL/$BTC moved downward toward the upward trendline, which has served as a buffer since mid-February. This series of higher lows indicates consistent buying pressure, suggesting that buyers are right there to defend this level during each pullback.
As the price revisits this support, traders are keen to see whether the upward trendline can hold once again. The chart positions the trade within a symmetrical compression pattern, indicating that price action is tightening between these two bounds, often a precursor to a directional move. The prior resistance area, marked by the horizontal red line, presents an essential point of reference for future movements.
If the trendline maintains its integrity, there’s potential for another push towards that resistance zone, creating an intriguing scenario for traders. The current structure illustrates not just a test of support but a possible consolidation phase preceding greater volatility in either direction.

